The workshop is due to take place in Cambridge in February with the ‘Not Quite Over the Hill’ group in Arbury, continuing to write predictions and look at what we have lost and gained and what to protect for the future. The group will again make their own data visualisations of different climate scenarios now and in the future using multi-coloured felt.

During the exhibition at FACT, Liverpool we ran workshops and activities with Fact’s Digital Ambassador’s over 60s group based, the group built a set of Mini Prediction Machines that the groups that how the weather and climate is changing and we explored what other things we wanted to track, protect, gain and lose in the future.
As part of the development of The Prediction Machine a series of public workshops took place in Loughborough – exploring how we mark, record, understand and respond to climate change in our everyday lives. Three separate groups took part – a regular monthly workshop over six months and one off workshops with the craft and writers group at Loughborough Library, below is documentation of these activities.
Local residents in Loughborough and the surrounding area, students and staff at the University were invited to participate in the project in order to be part of devising the predictions for the machine and to join a ‘prediction network’. People who participate were involved in marking moments of climate change in their everyday lives, sharing these experiences and finding ways to respond. As The Prediction Machine goes on tour in 2015 it is hoped that participants in each location where the machine goes will connect and be able to share their experiences and responses with each other.
Participants in the project also had the opportunity to contribute to a study of how we perceive experiences of climate change in our local areas and how we can respond to these experiences – taking place with Horizon Digital Economy, University of Nottingham and Dr Candice Howarth, Anglia Ruskin University.
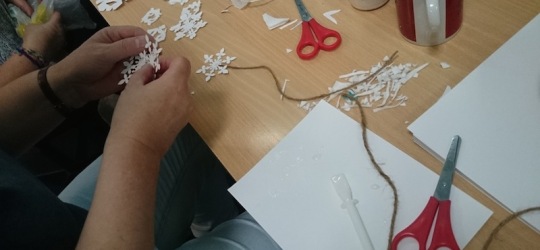
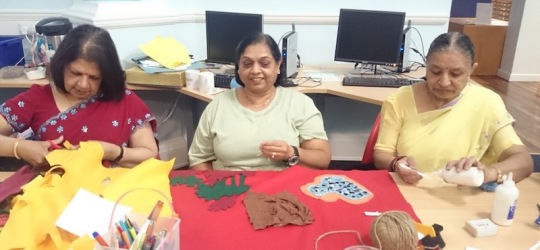
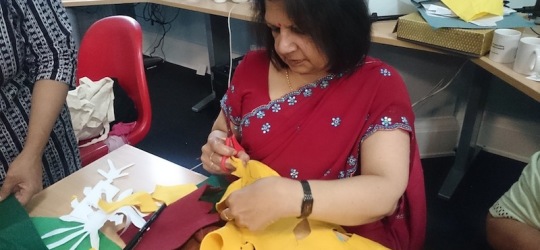
The Craft Workshop
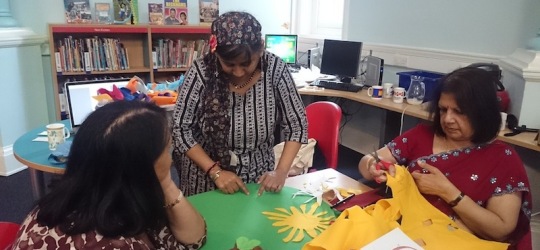
I had the privilege to work with the womens’ craft group that meet regularly at Loughborough Library on Thursday mornings and what a wonderfully welcoming and imaginative group they are!
The session focused on the craft elements of the project and exploring climate data. We started with an introduction to the project, the machine and how I am trying to match scientific data with visual experiences and physical objects.
I made fortune cookies to show the group the concept (with three different plates of cookies relating to different future climate scenarios) and then showed them data maps made by the previous groups I have worked with.
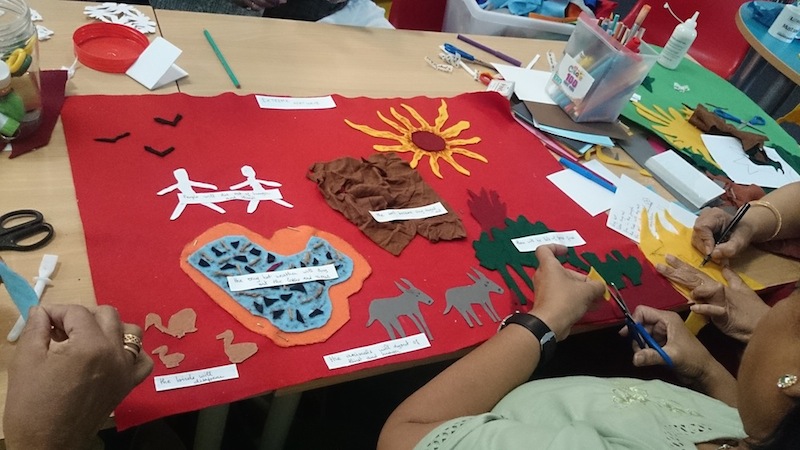
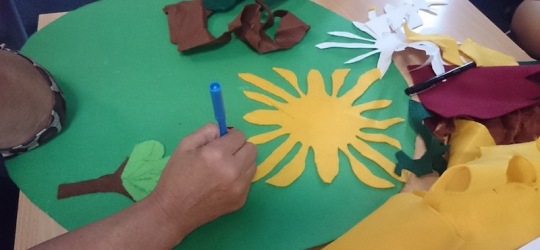
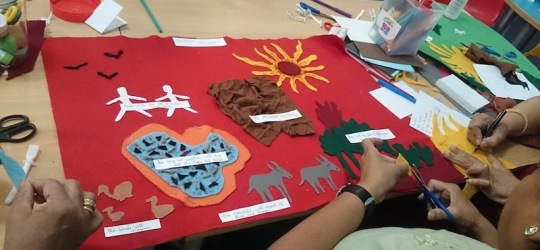
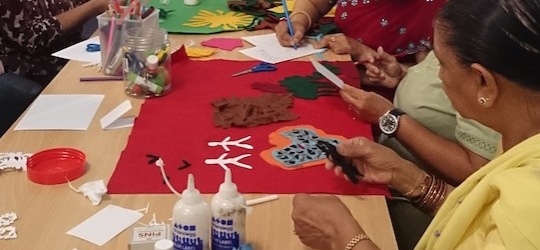
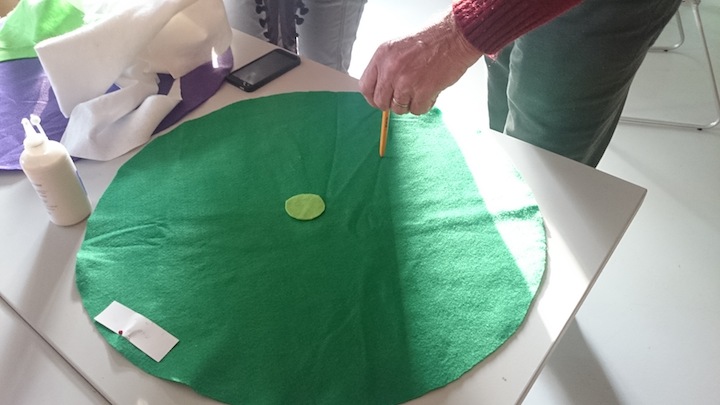
In response they made their own felt data maps and wrote their own predictions for climate change in 2044, whilst having a really interesting discussion about how they have experienced changes in weather and climate throughout their lives and particularly in Loughborough.
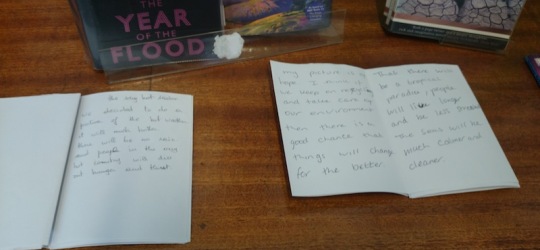
The group made a series of data maps with predictions attached and wrote storybooks to accompany the maps.
The Writers Group
The writers session worked in a similar way but with a focus on writing around the predictions. Again what a wonderful group to meet and work with and I was honoured that many extra people turned up who heard about my workshop who didn’t normally attend. With this group we went across the road into the park to do the human sensory activity. To do this we wrote down on a scale between 1-10 what we thought the temperature, humidity, sound, light and air quality was and I also asked them to note anything that they noticed or felt whilst standing in the park.
We then returned to the library and I asked them to write a description of how it felt in the park now and then how they would imagine the park would be in 2044 if there was a 3.7 degrees C increase in temperature. As a result each participant then read out their writing, which included a huge range of visions and styles that transported us to the future and back.
The predictions written by both groups will be added to the machine and the data maps will be exhibited at Lougborough Library alongside the machine.


The Monthly Group
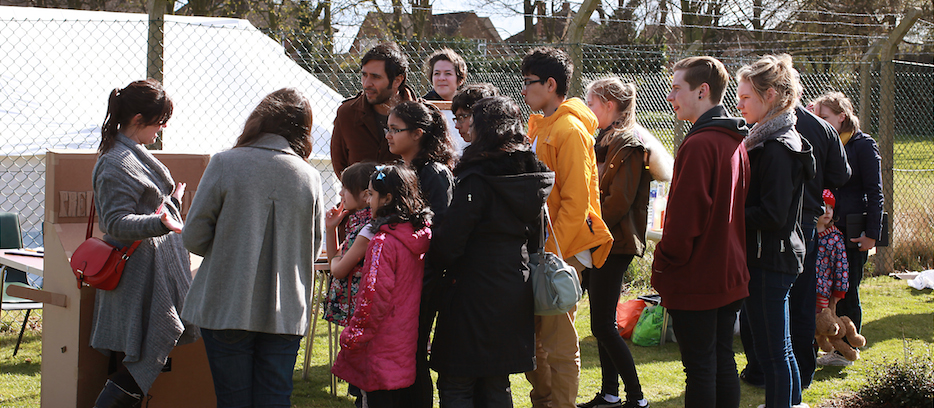
The first session was an introduction to the project, I took along the life-sized cardboard version of the machine to show people what the artwork will look like when it is exhibited at Pilkington Library (on the University campus) and Loughborough Central Library. I also made fortune cookies again, with a plate for a different future scenario (increased consumerist society, a collective environmentally conscious society or continuing as we are). Each cookie (these were made with a Brazilian Empadinha recipe) had a ‘climate fortune’ inside that related to the future scenario.
After presenting and talking about the project and also introducing the research that my colleagues at the University of Nottingham are doing with me (into the impact of this work on our responses to and perceptions of climate change) I introduced the first activity which asked the group to discuss three questions and note down their responses onto paper discs (see some of the responses in the image/alt text above). The questions were:
1. How do we connect climate change and weather
2. How can we connect data and narrative
3. How do we mark and respond to these changes
The aim of this session was to start a very broad discussion about how we think and feel about the issues at the core of The Prediction Machine project.
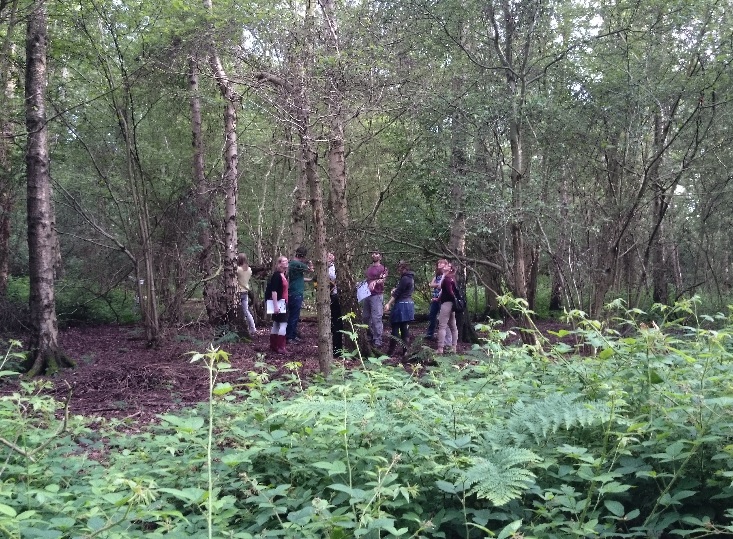
The second session involved the group (with many new members) joining myself and Jon Millet, an ecologist based at Loughborough University, on a walk in the forest. Jon presented his research in the forest on Ash dieback, explaining how the forest will change in the future and how it has changed and evolved since it was cut down in the second world war. We then became ‘human sensors’ in the forest, enacting with our bodies how the weather stations that Jon is using to sense changes in the forest works (and how the weather station works that will control The Prediction Machine).
It was a lovely walk on a sunny day in this fascinating ancient forest that has been destroyed and regrown, half through planting and half naturally. We could feel a difference in light and environment between these two halves and very much felt the ongoing impact of the winter storms, where the soil (particularly on the replanted side of the forest that has less light reaching the floor below the tree canopy) is wet with mud and without heavy boots was nearly impassable at times. Jon told us that the soil here hasn’t recovered from the huge amounts of rain so any additional rain has just saturated the soil.
The next session will start to look at how we interpret that moment in the forest (and for people who missed the session their will be an opportunity to do there own human sensing), looking at other artists, writers, film makers interpretations of the environment and how it will change in the future we will begin to compose our predictions for what standing in the forest will feel like in 2044…
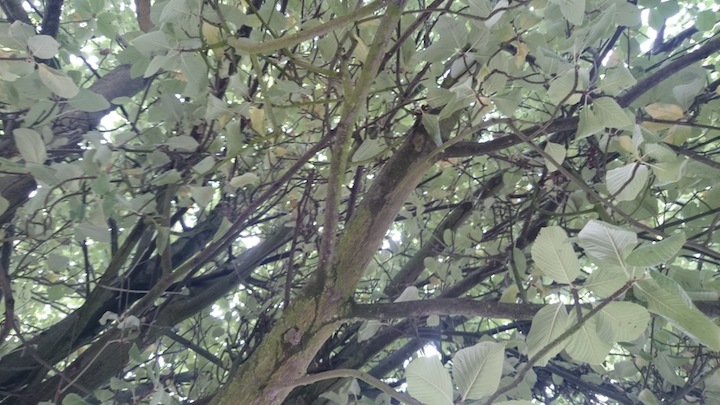
The third session took place indoors back at Radar’s space at the University and by a tree in the car park outside the art and design building.
We began with a discussion about weather that we had noticed and experienced since the project began, noting that although there hadn’t been any obviously extreme weather there were some strange things happening, talking about hail stones and how early the blackberries had fruited this year compared to last year when they had been really late. This resulted in a very informative presentation by one of the group who is a retired meteorologist and a discussion about the weather coming later in the week that was expected to be quite extreme – heat and storms. He presented the satellite images of the weather front (coming up from Spain) and explained how it was creating unsettled weather over the UK.
We then went outside to the carpark and did the human sensor activity again, noting the difference between being in the forest and standing under a tree in a car park alongside a busy road!
When we returned indoors I presented some examples of how other people had reflected on the weather, climate change and the future through poetry, stories, drawings and films. We saw clips from some of the films that are listed here and discussed these.
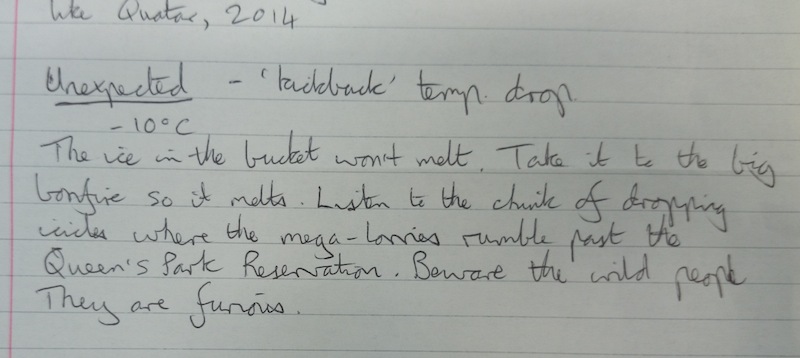
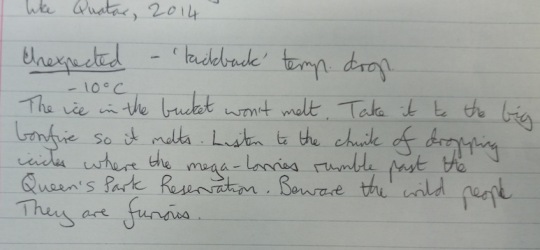
The final activity was to begin to write our own predictions based on everyone’s experience of what had been recorded under the tree in the car park and then in consideration of what the same weather conditions would be like if it was 2 degrees warmer – an estimated temperature increase for 2044.
As a result I am now adapting the wonderful stories and predictions that were written in that short time, to apply them to the data being captured by the weather station at Loughborough University. More to come on this in the next session.
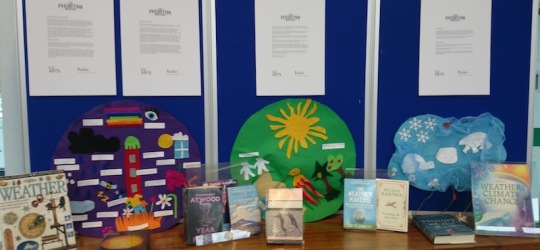
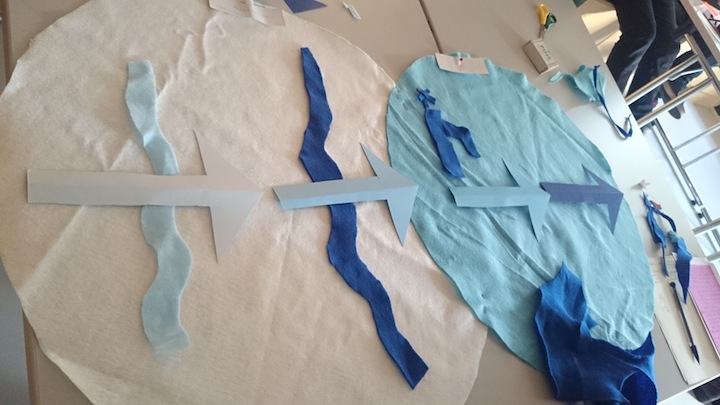
August’s workshop involved visualising the data we collected whilst doing the human sensor activities and creating felt data maps for each weather type that we can then add the predictions to. At the end of the next session we will have a felt data map to represent each weather type being used to understand current weather and then we will be able to sort which prediction goes with which weather type. These felt data maps will become artworks in themselves as well as a way to understand how we can allocate poetic and evocative narratives about the future to the data.
We also talked about how we can mark this process through the event planned to take place at the end of the exhibition in October. We talked about folklore, seasonal festivals and harvest festival. We also talked about how we can symbolise and ritualise complex and distant things like seasons, climate and weather that are hard to understand in our everyday lives – which then led to making the abstracted data felt maps.
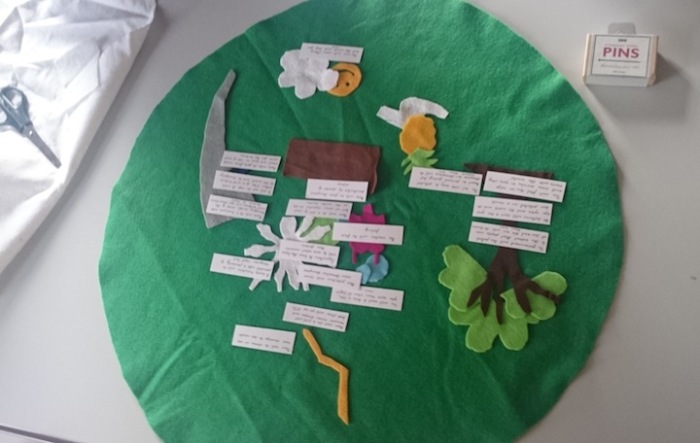
Mild Weather Data Map
1 to 15 degrees C
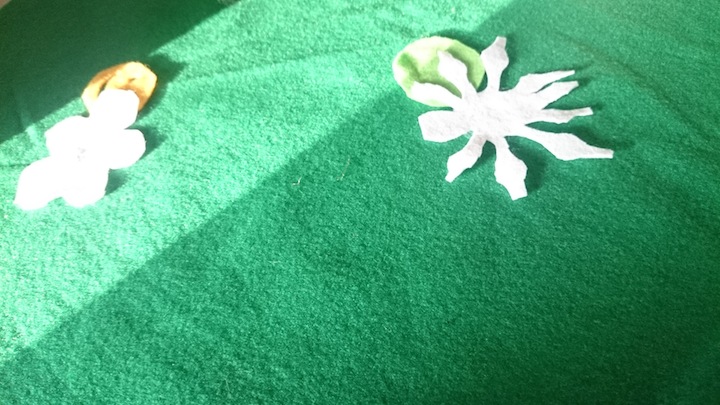
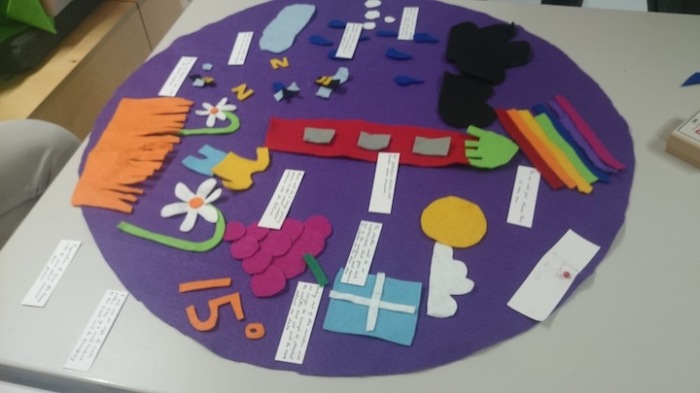
Heatwave Weather Data Map
29 to 100 degrees C
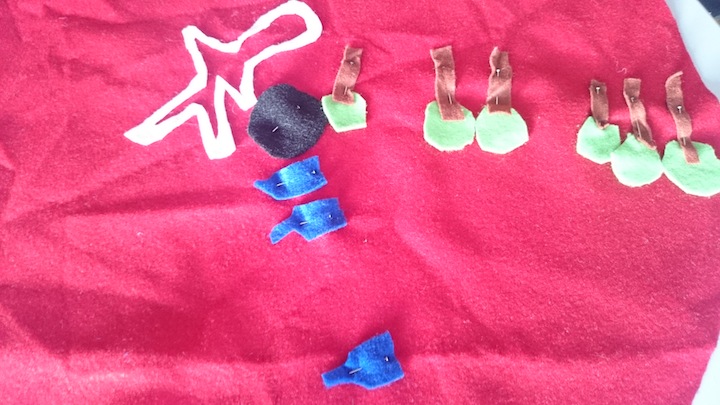
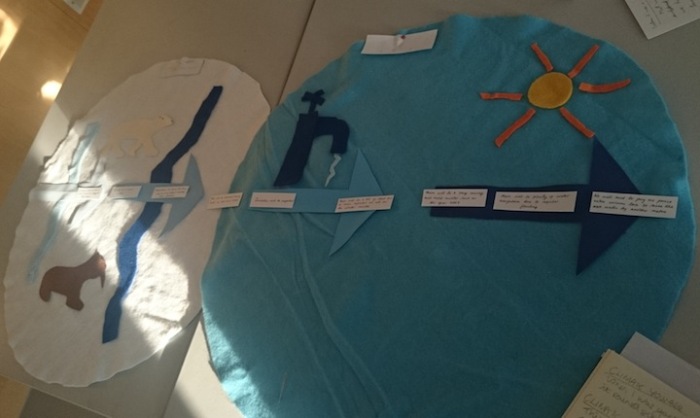
Arctic, Freezing and Cold Weather Data Maps
-100 to -0 degrees C
The Final Session took place this week and it was sad to end the sessions, particularly as a core group has emerged with the wonderful team. I really want to thank all the people that came along to the workshops over the last six months and for their contributions to the machine, the predictions and the video messages.
This session focused on how we apply the predictions to the data, through finishing off the data maps. Ravi also filmed each member of the group to make the video messages that will appear on the screen in the machine. We also discussed what the final event will be at the end of the exhibition to mark the changes we have experienced over the last six months – more information about this event is here…
The data maps look amazing and create a really interesting interpretation of the process we have been through as a group, how we connect the climate data to our narrative predictions (that will be in the machine) and also gave us ideas for the final event. These data maps will be on display at Loughborough Library during the exhibition of The Prediction Machine, Satuday 18th – Sunday 26th October.